
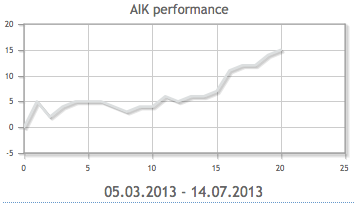
Customizable team performance graphs added to our head-to-head team comparison statistics:

This example is from BK Häcken vs AIK comparison. It is based on your previous games settings and data filtering. In this example we have all previous 20 games for both teams, but you can customize the number of games, home team at home vs away team away, first half data only, 1×2 odds filtering etc.
Update: This post was originally made before the above example game was started. The result was 3-2 win for AIK (with much more solid performance graph 😉 ). AIK was the underdog by bookers’ odds (3.24, 9/4 and more).
On the Season subpage of each league there are now home advantage graph and over x.5 goals graph. This example is from English Premier League:

The graphs at the bottom are the new features. You can instantly see that there has been growing number of over 2.5 total goals games in the previous seasons.
There is also something special for Statistics Pro customers when comparing national teams 🙂
Update 23.7.2013: Bet Simulator II released with graphs and improvements in simulation calculations:
