

How does Poisson distribution work in football (soccer) goal probability calculations? In this article we have research data from the following European leagues in our soccer database:
Leagues: English Premier League, English Championship, Italian Serie A, Spanish Primera División and French Ligue 1
All the results we have till 9th of March 2013. Regular season games and regular playtime only, awarded games not included (note: we might not have all the awarded games info stored into our database).
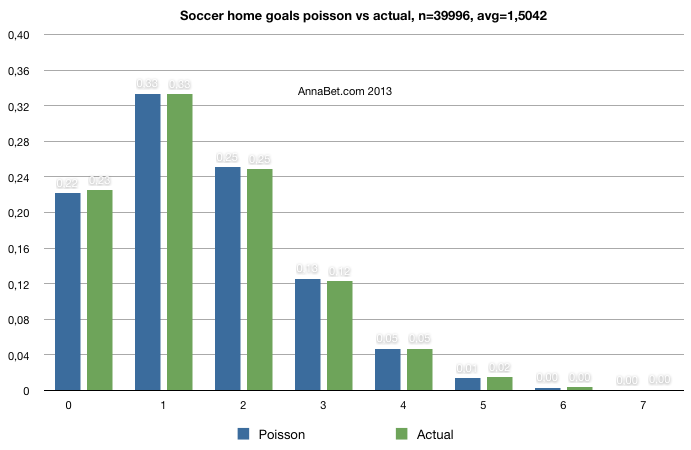
Home goal average = 1.5042
Away goal average = 1.0639
n = 39 996 games
HOME team goal distribution POISSON vs ACTUAL

AWAY team goal distribution POISSON vs ACTUAL


Poisson results here are quite accurately showing goal probabilities per team – except for the high number of goals for away team (which has much lower goal average).
Final score calculation MATH vs ACTUAL
Mathematically we can calculate each possible final score probability by multiplying each home goal probability by each away goal probability. Here you can see the results. Math (Poisson) works quite well for most of the scores but not all:
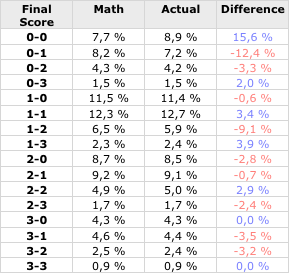
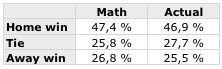
Mathematical model differs most at 0-0, 0-1 and 1-2 results. Notice that real world tie (draw) probability is higher than what is mathematically calculated:
*Math percentages calculated using each possible goal combination – not just 0 -> 3 goals as shown in the Final score table.
Poisson Distribution is a simple predictive model that doesn’t allow for a lot of factors. The system is of greatest benefit over a long period of time – using it for a whole season’s worth of games, rather than one-off matches.
PoissoNed! calculator
There is an easy way to calculate a great variety of soccer goal probabilities (for example: correct score, asian handicaps, total goals, team totals) from goal average values using PoissoNed! online calculator which has also lots of adjustable parameters like tie probability multiplier or adjusting (“forcing”) the results to certain home win – tie – away win % distribution:
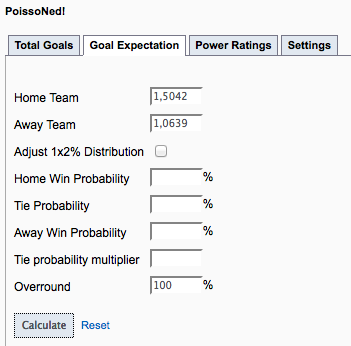
See some of the results here (open the calculator from the link above to see all the probabilities). Value odds (decimal odds format) are next to the percentages. They are also available in UK and US odds.

See also this guide: Poisson Distribution for Soccer Betting by PinnacleSports
Excellent article. I would like to draw your attention to a poisson tool (http://scoreline.tips) I have created for modelling football matches. It uses a current database of matches to calculate the mean goals for each team home and away, for and against, and then shows the poisson distribution of the scorelines. You can enter your own custom values if you want.
really good website – from what I understand your site seems to give strong predictive results